

Close-up of a Power BI dashboard displayed on a large monitor in a corporate office, showing financial KPI tiles and bar charts with precise data labels, cool studio lighting, dark interface with blue accent highlights, screen sharply in focus
— Expertise sectorielle locale

Vos KPI, vos contraintes, votre secteur.

Finance, télécoms, mines, distribution, luxe, santé, agro-industrie, secteur public, ... nous intervenons dans tous les secteurs.
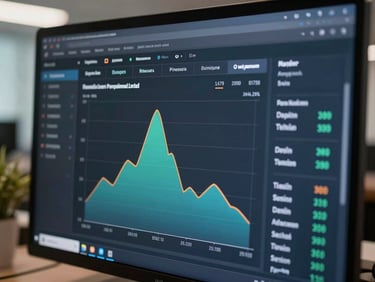
Close-up of a Power BI financial dashboard on screen showing revenue waterfall chart and margin KPIs, cool office lighting, dark theme interface, precise data labels clearly visible
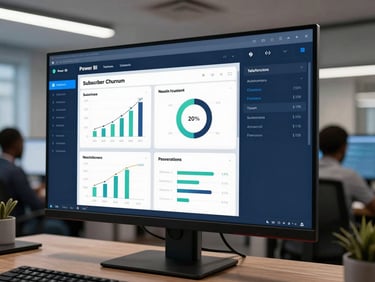
Power BI telecom dashboard displayed on a widescreen monitor showing subscriber churn rate and network performance tiles, African office environment, cool fluorescent lighting, dark blue interface
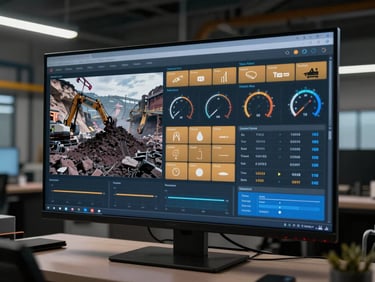
Mining operations dashboard on large monitor showing ore extraction volume and equipment utilization gauges, industrial site office, cool overhead lighting, dark interface with amber and blue KPI tiles
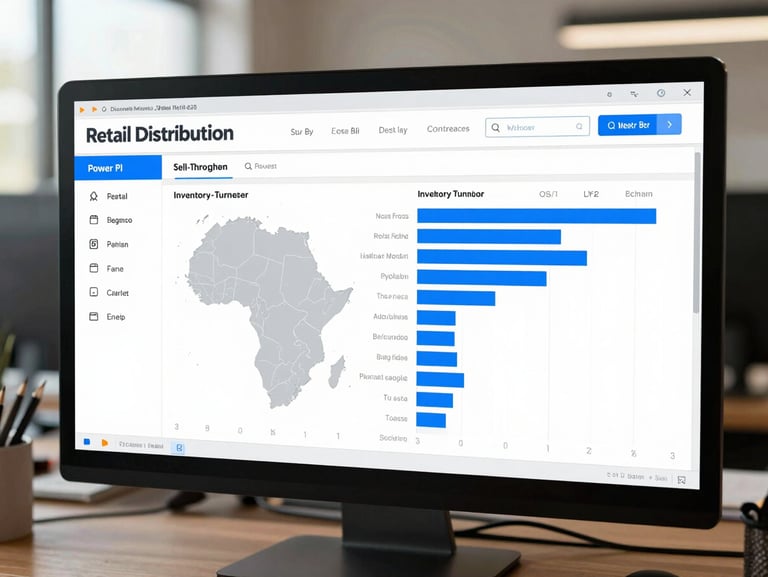
Retail distribution Power BI dashboard on screen showing sell-through rate and inventory turnover by region across West Africa, natural office daylight, light-themed interface with blue accent bars
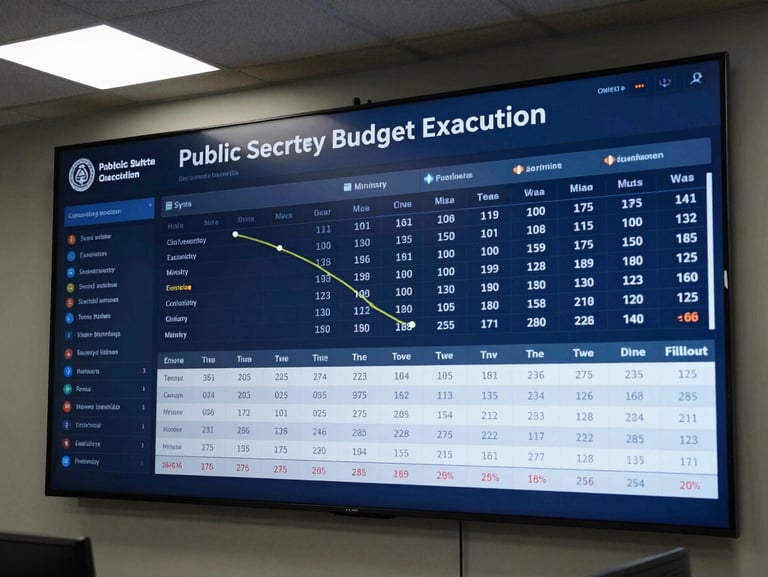
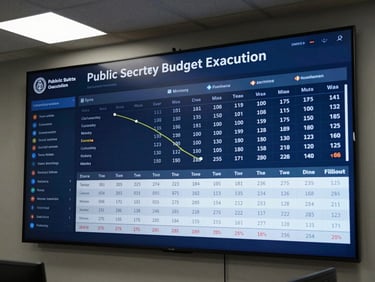
Public sector budget execution dashboard displayed on government office screen showing expenditure rate versus allocation by ministry, overhead fluorescent lighting, clean dark-themed interface with blue and white data tiles
/ Cinq verticaux maîtrisés

Des déploiements réels, secteur par secteur

Finance & Banque
Télécommunications
Mines & Ressources

Clôture mensuelle en deux jours

Churn et ARPU sous contrôle

Production et coût à la tonne

Automatisation du reporting réglementaire, suivi des ratios de liquidité et consolidation multi-entités, sans double saisie ni exports manuels.

Tableaux de bord réseau et commerciaux unifiés, alerte précoce sur la désertion client, analyse géographique de la couverture par zone.

Suivi de la disponibilité des équipements, reporting HSE en temps réel et consolidation des coûts opérationnels par site et par équipe.

Distribution & Commerce
Secteur Public

Ruptures de stock anticipées

Budget exécuté, dépense justifiée

Visibilité en temps réel sur les flux de marchandises, prévisions de réapprovisionnement par point de vente et analyse des marges par référence produit.

Tableaux de pilotage budgétaire conformes aux normes UEMOA, suivi des marchés publics et reporting de performance par direction ou service.

Résultats mesurables, entreprises identifiables.

Nos études de cas documentent les métriques avant et après : délais, coûts, volumes traités, ...